Thursday, March 14, 2013

CROCS - CROX, I think I'll go barefoot this summer

CROCS - CROX, I think I'll go barefoot this summer


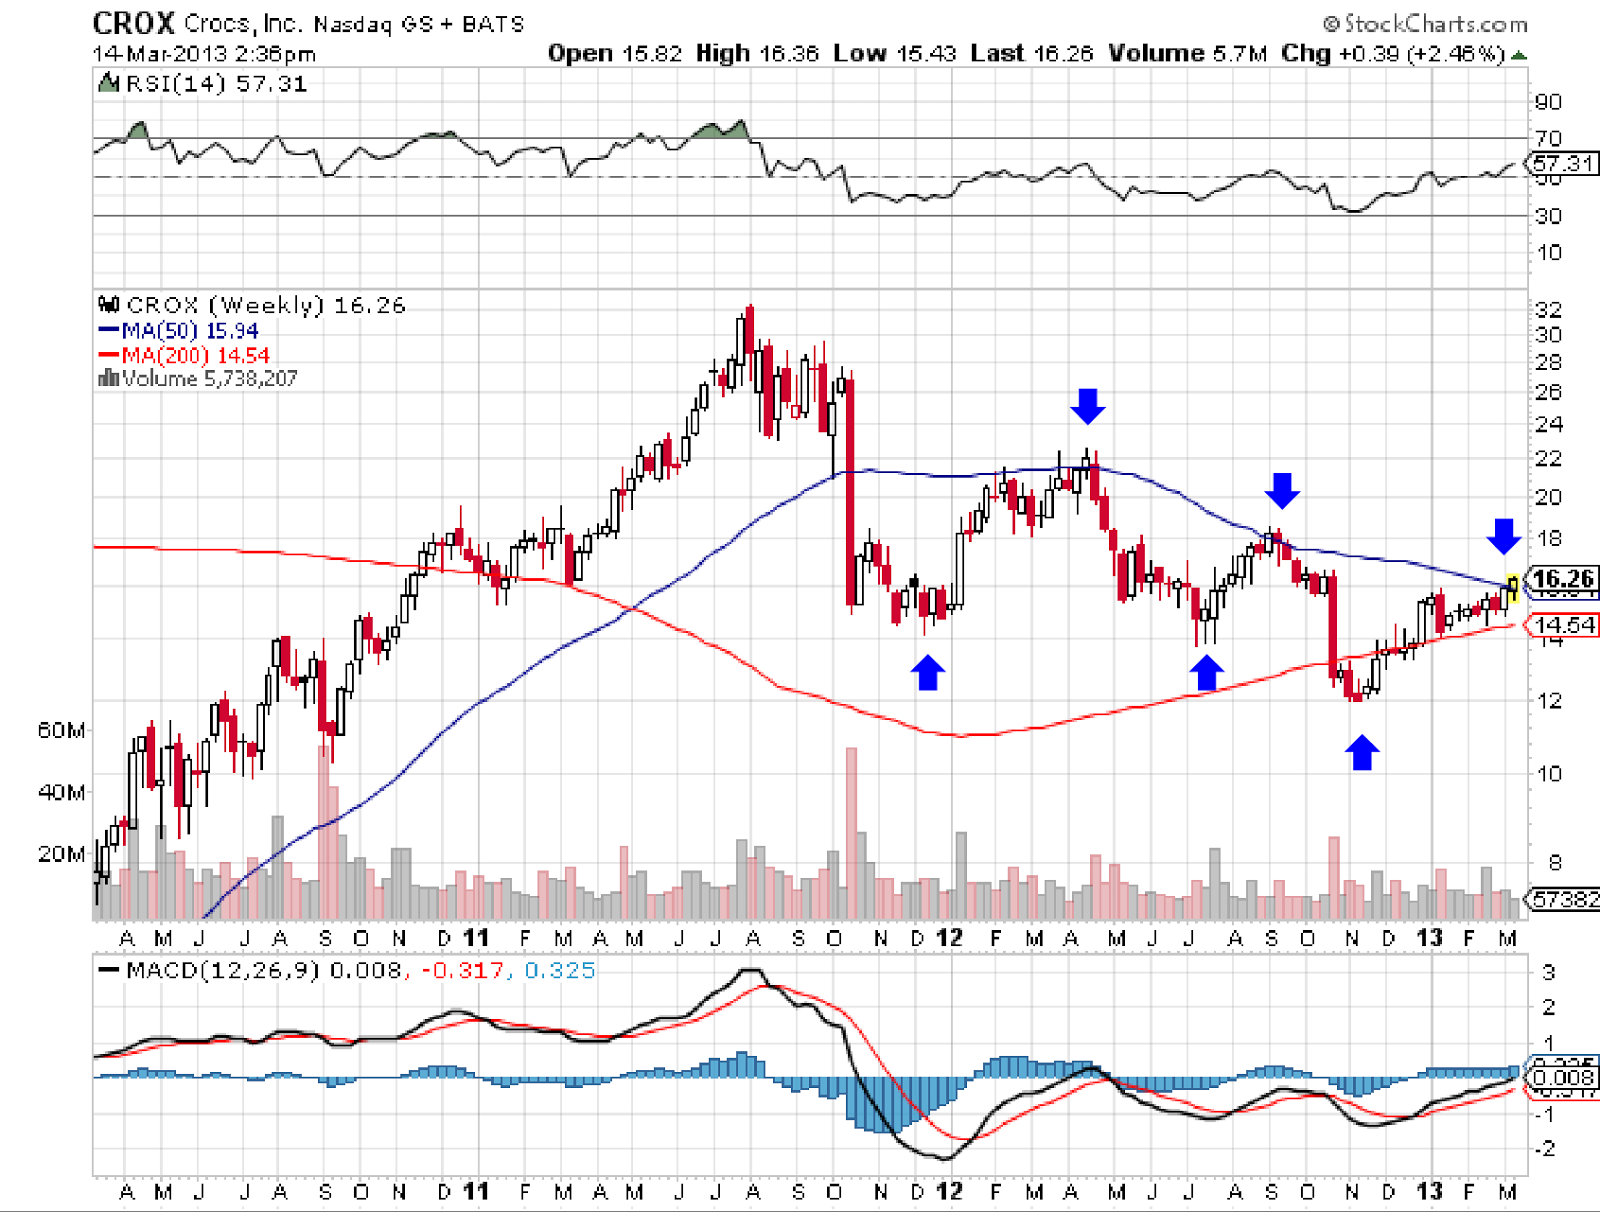
The daily chart for CROX looks to be coming upon a decision point, there has been a nice run up since the fall in line with the market. If it breaks through the $16 - $17 area the upwards trend looks to remain intact. Today it looks like there is some indecision and perhaps are turn is emerging. The reason for this may lie in the weekly chart below. The last year or so has seen lower highs and lower lows for a trend that is entirely downward in trajectory. Keep an eye out for a shorting opportunity.


Tuesday, March 12, 2013


Are the Canadian Financial Leaders being taken out?

It sure looks like RY is failing in the shorter term, new highs were not extended and there were 3 sharp days of a sell-off. The nice run up since the fall looks to be failing, and when the leaders of the market start to fail it is time to be cautious. Again, with low volatility protection (puts) can be had at a good price.

Another Canadian financial leader Brookfield has had some trouble the last three days. It looks like a 3 black crow candlestick pattern, this pattern is looked upon as a bearish signal.

Two financial leaders in Canada are showing weakness, be cautious around the sector as a whole.

Came across this chart for EWH while scanning, the Hong Kong ETF has failed a couple times now to push through to higher levels. Volume is slowing and the gap down today indicates some shorter-term exhaustion. Buy some puts for protection, they are cheap with low levels of volatility, or short possibly down to the $19.25 level.

Monday, March 11, 2013

My VCI trade is working out, the FB one not so much. Still the FB chart has not moved above the higher levels of a few weeks ago, I am holding on in the short term to see if it plays out to the downside, if it goes back above the $29 level I think I have no choice but to cover.


This is a long-term SPY chart that I produced the other day, it looks to me like a massive triple top is forming. Triple tops are like head and shoulder patterns, foretelling of a significant drop. That is a scary proposition, but I should not jump ahead... it has not formed yet. However, with declining volume and volatility at low levels the markets does seem ripe for a drop. I think one still has to trade as a bull in this bullish market, but be cautious. Charts are notorious for not developing the way one thinks, but this potentially huge signal deserves some attention. I recall hearing and seeing charts with very long-term patterns in 2008-09 with the idea that we are in a 14-16 year sideways market and that there would likely be one more harsh drop before the markets started on a true multi-year bull run. Always try to keep an eye out on the big picture.